Software Description:
GraphPad Prism was originally designed forexperimental biologists in medical schools and drug companies,especially those in pharmacology and physiology. Prism is now usedmuch more broadly by all kinds of biologists, as well as social andphysical scientists. More than 200,000 scientists in over 110countries rely on Prism to analyze, graph and present theirscientific data. It is also widely used by undergraduate andgraduate students.
Nonlinear regression
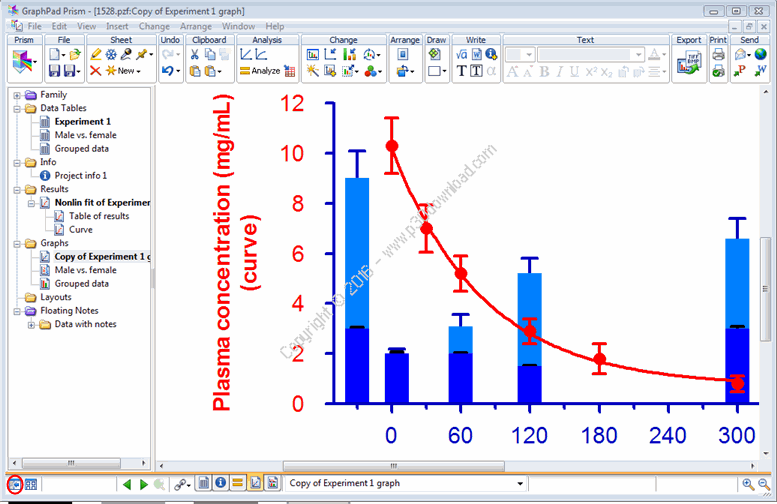
Nonlinear regression is an important tool in analyzing data, but isoften more difficult than it needs to be. No other programsimplifies curve fitting like Prism. In fact, you can usually fitcurves in a single step. Just select an equation from the extensivelist of commonly used equations (or enter your own equation) andPrism does the rest automatically — fits the curve, displays theresults as a table, draws the curve on the graph, and interpolatesunknown values.
Place data for multiple data sets side-by-side on an organized datatable, and Prism can fit them all the data sets at once. You canfit the same model separately to each data set, use globalnonlinear regression to share parameter values among data sets, orfit different models to different data sets.
Don’t be fooled by the simplicity. Prism also gives you manyadvanced fitting options. It can report the confidence intervals ofthe best-fit parameters as asymmetrical ranges (profile likelihoodmethod), which are far more accurate than the usual symmetricalintervals. It can also automatically interpolate unknownvalues from a standard curve (i.e., to analyze RIA data), comparethe fits of two equations using an F test or Akaike’s InformationCriterion (AIC), plot residuals, identify outliers, differentiallyweight data points, test residuals for normality, and muchmore.
Understandable statistics
While it won’t replace a heavy-duty statistics program, Prism letsyou easily perform basic statistical tests commonly used bylaboratory and clinical researchers. Prism offers t tests,nonparametric comparisons, one-, two- and three-way ANOVA,analysis of contingency tables, and survival analysis. Analysischoices are presented in clear language that avoids unnecessarystatistical jargon.
Unlike other programs, Prism provides understandable statisticalhelp when you need it. Press “Learn” from any data analysis dialogand Prism’s online documentation will explain the principles of theanalysis to help you make appropriate choices. Once you’ve madeyour choices, Prism presents the results on organized,easy-to-follow tables. The Prism documentation goes beyond anythingyou would expect. More than half of it is devoted to thoroughexplanations of basic statistics and nonlinear curve fitting, toteach you what you need to know to appropriately analyze yourdata.
Analysis checklists
Once you’ve completed the analysis, Prism’s unique analysischecklists help you make sure you chose an analysis appropriate foryour experimental design, and that you understand the assumptionsbehind the analysis.
Retrace every analysis
It isn’t really science unless you can document exactly how yourdata were analyzed. WIth Prism this isn’t a problem. You’ll neverwonder how the results got there. Even if the work was done bysomeone else, you can review (and change) all analysis choices, andsee the sequence of analyses (i.e. that the X values weretransformed to logarithms before the curve was fit). Similarly, youcan easily check if error bars represent the SD or SEM (orsomething else).
Automation without programming
All parts of your Prism project are linked. This means that whenyou fix a data entry error, Prism automatically updates allresults, graphs, and layouts. Another advantage is that you caninstantly analyze a repeat experiment. After you’ve polished theanalysis and graphing steps with data from one experiment, youdon’t have to repeat all those steps. Prism provides several waysto recycle your work — to instantly analyze and graph a repeatexperiment, without repeating any tedious steps and withoutrequiring any scripting or programming. Prism also offers ascripting language for those who want more complex automation.
Automatic error bars
If you enter raw data, Prism can automatically plot error bars asSD, SEM, range, interquartile range, or 95% confidenceinterval.
If you computed error values elsewhere, enter them into labeled (SDor SEM) subcolumns. Prism’s analyses (i.e. t test, ANOVA,regression) will take into account the SD (or SEM) and samplesize.
A complete record of your work
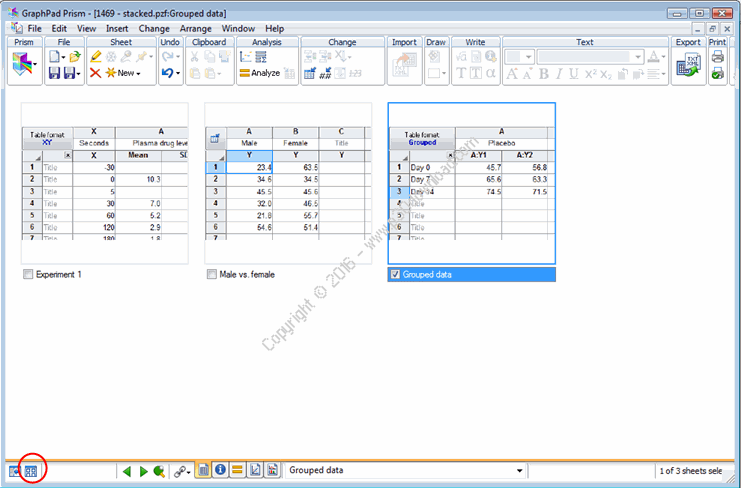
A Prism project file can contain more than data, analyses andgraphs. A Prism file can be a complete record of your experiments.Each file can contain any number of data tables, info pages,analysis results, graphs, and page layouts.
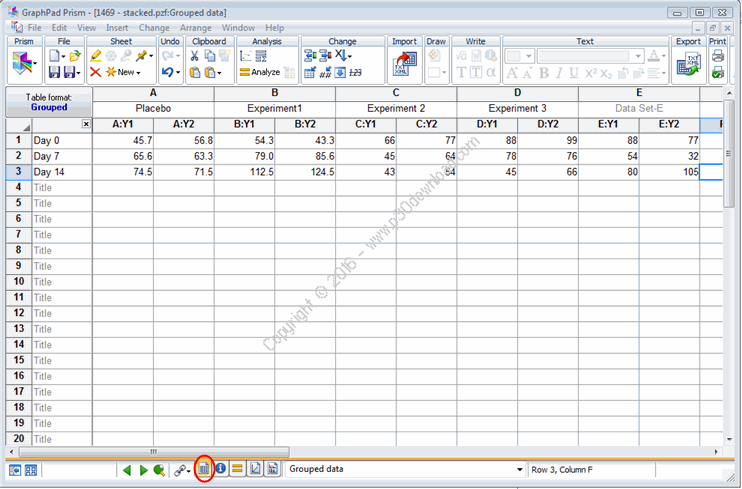
Data tables can contain not only the data you analyze and graph,but also the data you decided to exclude, which remain on the datatable (in blue italics). You can highlight values you want toreview later.
Each info page can store both unstructured notes and structuredinfo constants such as lot numbers, concentrations, notebook pagenumbers, etc.
Graphs and layouts can be embellished with text, lines, arrows,boxes, tables, equations, pictures and more.
Annotate any page with color-coded floating notes, and highlight(in a color you choose) the names of pages you want to look atagain, or want someone else to review.
Installer Size: 16.1 MB
Download Links : GraphPad Prism v7.03 + Crack
