


ScreenShots:


Software Description:
Whether you are tuning for the first time or doing advancedperformance optimization, Intel VTune Amplifier XEprovides a rich set of performance insight into CPU & GPUperformance, threading performance & scalability, bandwidth,caching and much more. Analysis is faster and easier because VTuneAmplifier understands common threading models and presentsinformation at a higher level that is easier to interpret. Use itspowerful analysis to sort, filter and visualize results on thetimeline and on your source.
Here are some key features of “Intel VTune AmplifierXE”:
What should I tune first? – Quickly locate code taking a lot oftime
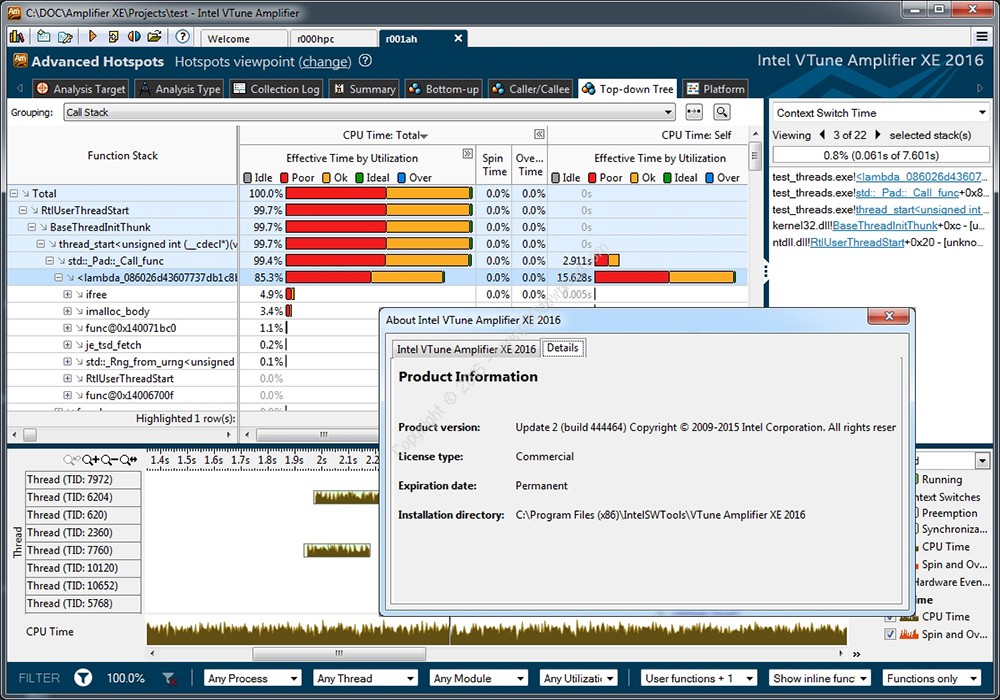
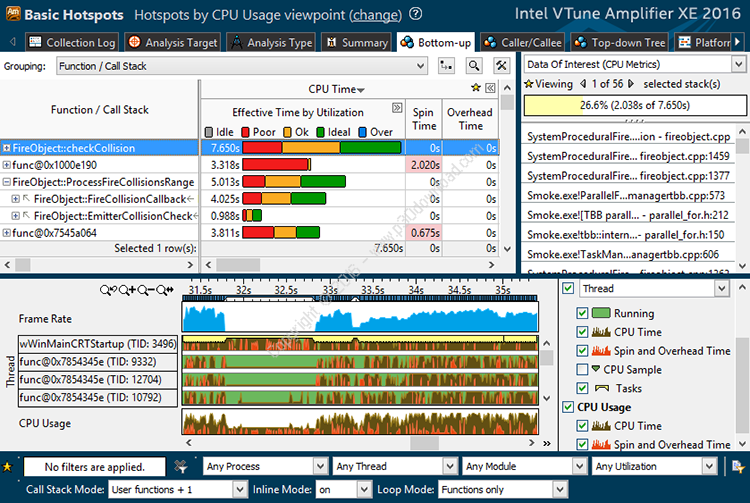
Hotspots analysis gives you a sorted list of the functions using alot of CPU time. This is where tuning will give you the biggestbenefit. Click [+] for the call stacks. Double click to see thesource.
Analyze results faster – See the profiling data on your source
A double click from the function list takes you to the hottest spotin the function.
Threaded Performance Is Critical in today’s Multicore World
VTune Amplifier’s built-in understanding of parallel programmingmodels including Intel® Threading Building Blocks, OpenMP* 4.0 andIntel® Cilk™ Plus makes it easy to see and understandmulti-threading concepts such as task begin/end, synchronization,wait time… Lock & waits analysis (first image below) is oneexample of how this is useful. Visualization on the timeline(second image below) lets you easily see lock contention (lots ofyellow transitions), load imbalance and inadvertent serialization –all common causes of poor parallel performance.
Quickly find common causes of slow threaded code with “locks andwaits” analysis
Waiting too long on a lock while the cores are underutilized duringthe wait is a common cause of slow performance in parallelprograms. Profiles like “basic hotspots” and “locks & waits”use a software collector that works on both Intel and compatibleprocessors.
Find the answer faster – Mine the data with timeline filtering.
Select a time range in the timeline to filter out data (e.g.,application startup) that masks the information you need. When youselect and filter in the timeline, the grid that lists functionsusing a lot of CPU time updates to show the list filtered for theselected time. Yellow lines above show transitions. A high densityof transitions may indicate lock contention and poor parallelperformance. Turn off CPU time marking to diagnose issues with spinlocks – see just when threads are running or waiting and quicklyspot inadvertent serialization.
Easy Profiling of Remote Systems – License only required on host,not target.
You can easily collect data on your current host or a remotesystem. Or collect data using the command line on the remote systemand import the data for analysis locally.
Tip: For the best performance avoid VNC’s slow graphics. Run the UIlocally. Import data from the remote target. No license is requiredfor collecting data which makes for a simple lightweight install onremote systems. A license is required to view or analyze the datacollected.
Tune Drivers. Get High Resolution with Low Overhead
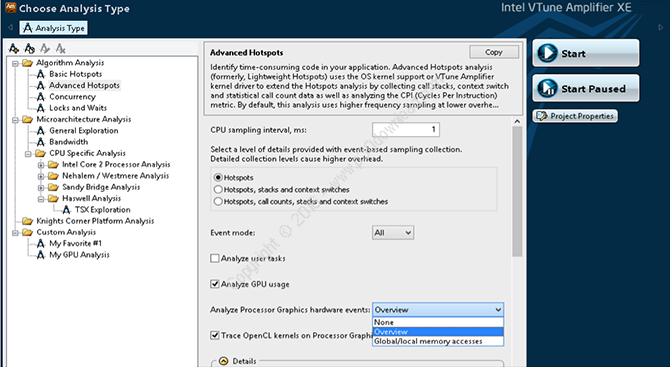
Intel® processors have an on chip Performance Monitoring Unit(PMU). In addition to “basic hotspots” analysis that works on bothIntel and compatible processors, VTune Amplifier XE has “advancedhotspots” analysis that uses the PMU to collect data with very lowoverhead. System wide analysis lets you analyze drivers. Increasedresolution (~1 ms vs. ~10 ms) can find hot spots in small functionsthat run quickly.
Bandwidth and Memory Analysis Made Easy
Use the Memory Access analysis to identify memory-related issues,like
Bandwidth-limited accesses. Quickly see a timeline of DRAM andIntel QPI bandwidth for your program. The consumers of memorybandwidth will generally vary as your program runs. By viewing thebandwidth in a graph, you can see where in your application spikesin memory usage. Filter by selecting the area in the timeline wherethe spike occurs and see only the code that was active at thattime. This lets you isolate the individual contributors tobandwidth consumption and tune effectively.
Identify the code source and memory objects that are usingbandwidth. As a general rule a structure of arrays is more cachefriendly than an array of structures, but it all depends upon howyour program is accessing the data. Quickly identify datastructures that can be reorganized to consume less bandwidth.
For Linux targets, Memory Access analysis can be configured toattribute performance events to memory objects (data structures).You can see the parts of your code that are contributing to memoryissues. Sorting results by average latency helps to prioritize yourtuning efforts for maximum impact.
Opportunities Highlighted For Faster, Easier Analysis
The cell is highlighted in pink when there is a potential tuningopportunity. Hover to get suggestions.
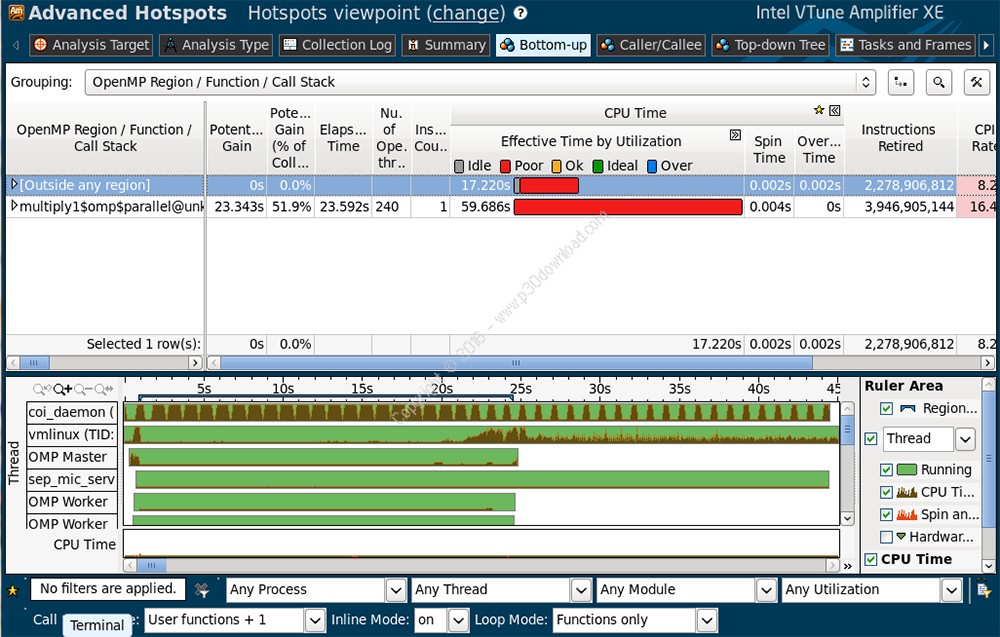
New– Easier, More Effective OpenMP* and MPI Multi-Rank Tuning
The new summary report quickly gets you the top 4 answers you needto effectively improve OpenMP* performance. Additional details foreach region are available by clicking the links.
Quickly See How to Improve OpenMP* Performance
Detailed data for each OpenMP* region highlights tuningopportunities. The region shown has the potential to run 34% fasterif it is rebalanced.
Easier Multi-Rank Analysis of MPI + OpenMP
VTune Amplifier’s summary view is enriched with a table of the topMPI ranks that will benefit from improved OpenMP performance
For hybrid MPI and OpenMP* applications, it is important to exploreOpenMP* inefficiency along with MPI communication between ranks.The lower the communication spin time the more the rank wasexecuting (vs. spinning) and the more impact OpenMP* tuning willhave on the application elapsed time. Use Intel® Trace Analyzer andCollector to tune MPI and select ranks with low communication spintimes for further analysis in VTune Amplifier. VTune Amplifier canbe installed on a cluster.
New – Easier OpenCL™ and GPU Profiling. Now for both Windows* &Linux
When tuning OpenCL on newer processors the GPU Architecture Diagrammakes it easier to understand GPU hardware metrics.
Analyze GPU and Platform Data
On newer Intel processors, optionally collect GPU and platform datafor tuning OpenCL and media applications. Correlate GPU and CPUactivities.
No special compilers, use your regular build
Use a production build with symbols from your normal compiler. Lowcollection overhead means accurate results you can count on.
Automate Using the Command Line
Use the included command line to automate regression analysis. Italso permits a light weight install on remote systems for simpleremote collection.
System Wide Analysis
Tune drivers, kernel modules and multi-process apps.
Auto Detect Microsoft DirectX* Frames
Got a slow spot in your Windows* game play? You don’t want to knowwhere you are spending a lot of time, you want to know where youare spending a lot of time and the frame rate is slow. VTuneAmplifier can automatically detect Microsoft DirectX* frames andfilter results to show you what is happening in slow frames. Notusing DirectX*? Just define the critical region using the API andframe analysis becomes a powerful tool for analyzing latency.
Low Overhead Java* Profiling
Analyze Java or mixed Java and native code. Results are mapped tothe original Java source. Unlike some Java profilers thatinstrument the code, VTune Amplifier uses low overhead statisticalsampling with either a hardware or software collector. Hardwarecollection has extremely low overhead because it uses the on-chipperformance monitoring hardware.
Analyze User Tasks
The task annotation API is used to annotate your source so VTuneAmplifier can display which tasks are executing. For example if youlabel the stages of your pipeline, they will be marked in thetimeline and hovering will reveal details. This makes profilingdata much easier to understand.
Tune for Intel® Xeon Phi™ Products
Hardware profiling is supported for Intel® Xeon Phi™ products andcan be launched from the graphic user interface. It can collectadvanced hotspots and advanced event data and has time markers forcorrelation of data across multiple cards.
Installer Size: 260.92 MB
Download Links > Intel VTune Amplifier XE 2016 update 2 + Crack