


ScreenShots:

Software Description:
Perfino is a highly complex piece of softwaredesigned to offer you the means of monitoring the activity andinteractions between multiple Java Virtual Machines, providing youwith insight into their performance, as well as their errors.
Micro-service friendly licensing
One license to monitor them all: With perfino you don’t have a capon the number of monitored JVMs or any other metric, such asrecorded business transactions.
No matter how large your system gets or how many micro-services youwant to monitor, your perfino license has you covered.
Immediately see what’s wrong
When you log into perfino, the dashboard shows you if everything isOK – or if something is going wrong. perfino gives you fine-grainedcontrol over what level of performance is acceptable for yourapplication. The dashboard is where you start to drill down intothe more detailed data views.
Show calls between VMs
perfino can monitor business transactions that span multiple VMs. Acall in the web layer that goes on to an EJB server and further toa web service – in perfino these operations are connected, evenwhen you do method-level sampling. The call graph not only showsyou the big picture of what is happening right now, but also whathas happened in the past.
React to off-nominal conditions
When something is seriously wrong, you want to take action: Createalerts, send emails or gather more detailed data. In perfino, youuse triggers and actions to configure your emergency responsestrategies. Realizing a scenario like “When a business transactionhangs, take a thread dump and send it to my inbox” is very easy inthe perfino UI.
Telemetries everywhere
Telemetries in perfino capture important scalar values in themonitored VMs, like the number of database operation per minute. Assparklines in the dashboard and VMs view, they give you an instantappreciation of the current trends, in their full display they goback in time to the very beginning. Telemetry data is neverdiscarded, only converted to higher resolutions.
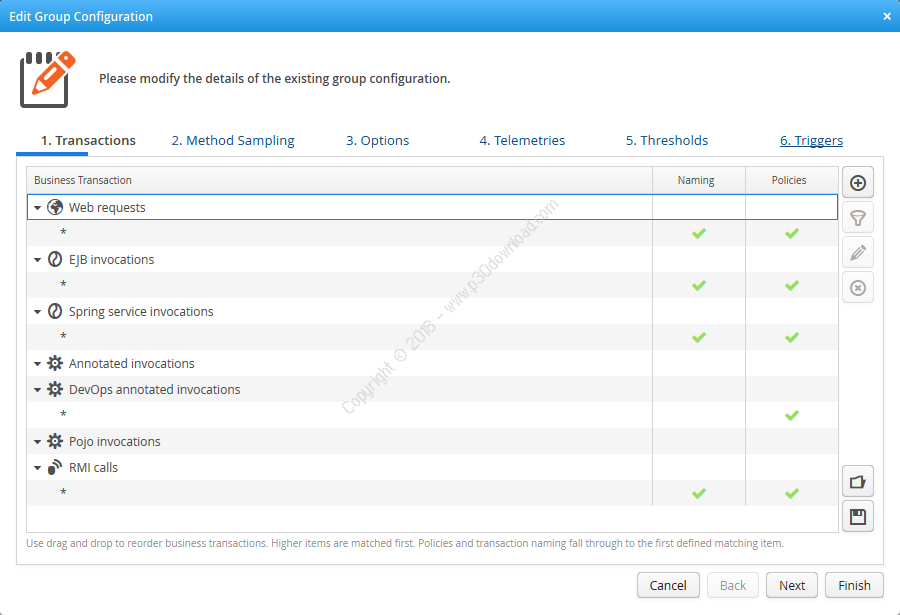
Ultra-flexible business transactions
perfino automatically detects a wide range of business transactionsfrom subsystems like servlet containers, EJBs or RMI calls. Inaddition, it offers you several ways to make any method call into abusiness transactions. Whether you explicitly select POJO methodsin the perfino UI, tell perfino about an important annotation oruse the API to create transactions in your own code depends on whatis most practical for you.
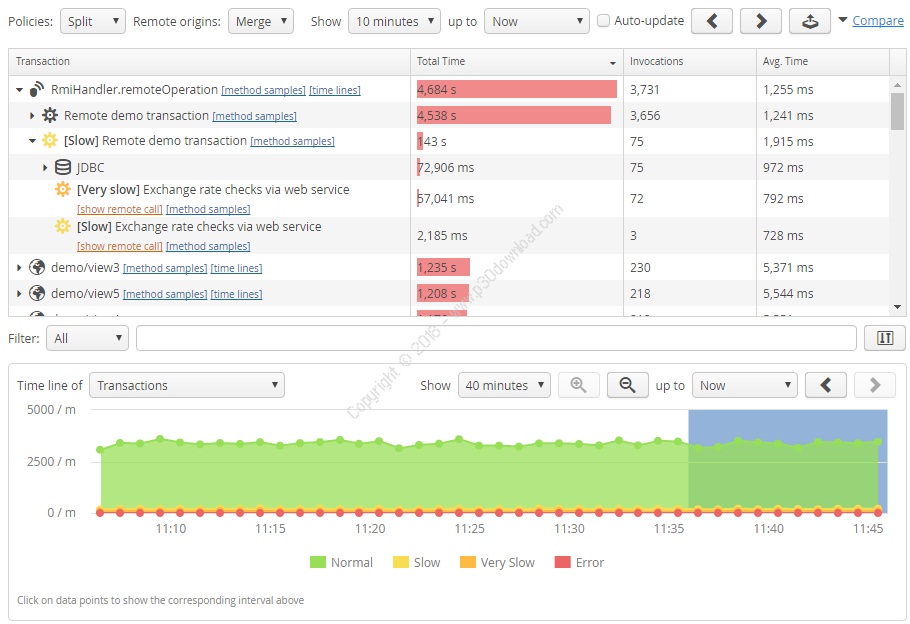
Call tree of business transactions
Transactions in perfino are organized into a cumulated call tree -just as you know it from your favorite profiler. The level ofdetail is up to you – it depends on what you configure as businesstransactions. Policy violations like very slow transactions areshown separately in the call tree, so you can analyze them inisolation. perfino also correlates business transactions on theserver with page load times in the browser.
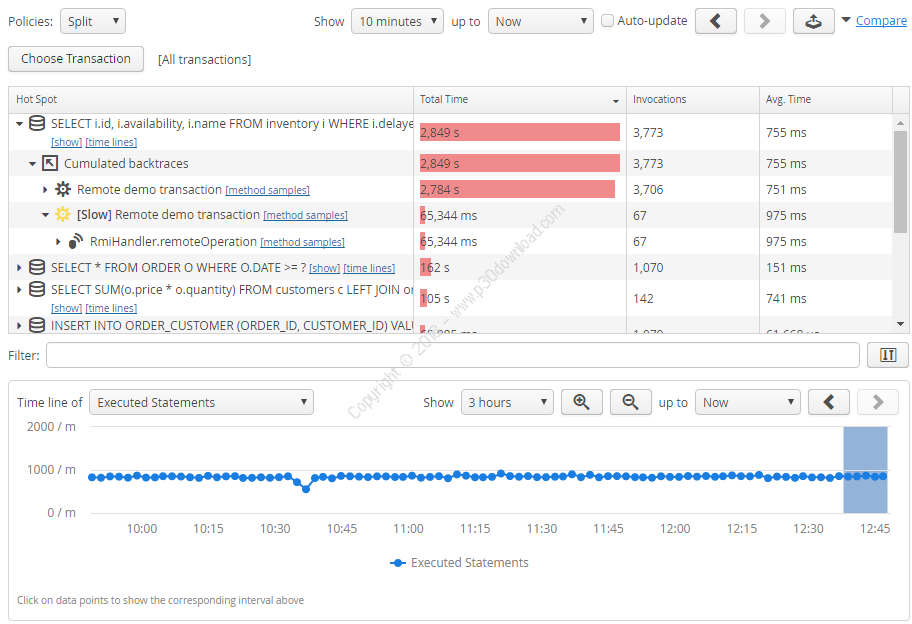
Database performance and bottlenecks
Database operations like JDBC statements, or queries to mongoDB andother NoSQL databases are first class citizens in perfino. When youask the question “Which SQL query is the slowest in myapplication?”, perfino delivers the answer together with cumulatedbacktraces pointing back to the business transactions that areresponsible for the queries.
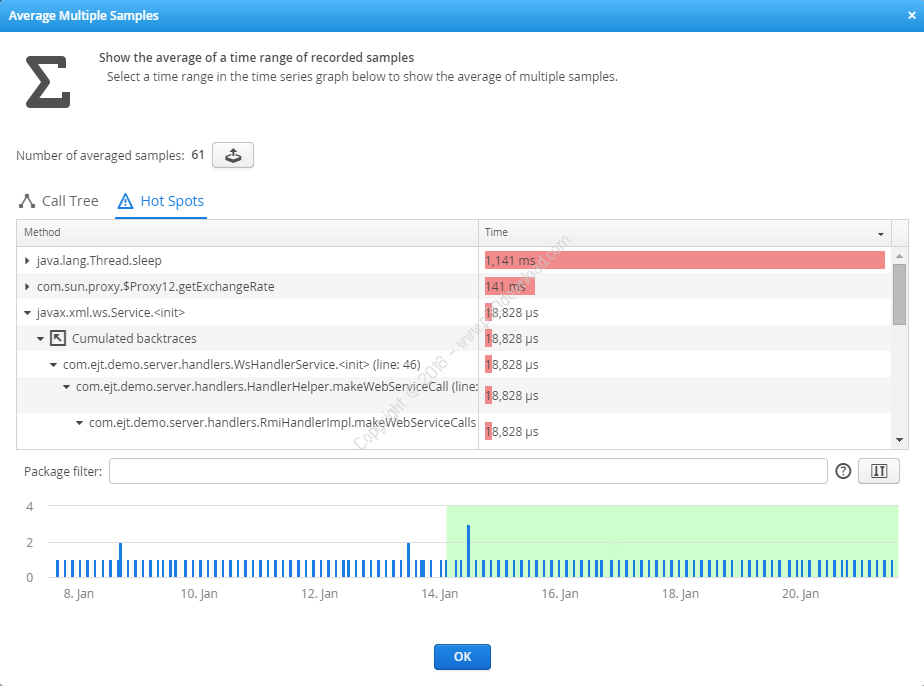
Method level sampling
To investigate the internal call structure and the method level hotspots of business transactions, perfino performs periodic methodlevel sampling on a per-transaction basis. For slow and very slowtransactions you can configure automatic method level sampling. Inmany cases, these samples give you an immediate explanation forperformance problems that are not related to databases.
Historical comparisons
Being able to compare performance between two points in time isimportant, especially for agile release managements. With perfino,you can look back indefinitely to compare selected businesstransactions or entire call trees – your data is cumulated tolarger time intervals as time goes by. And comparison functionalityis built directly into the views that you use for viewing thedata.
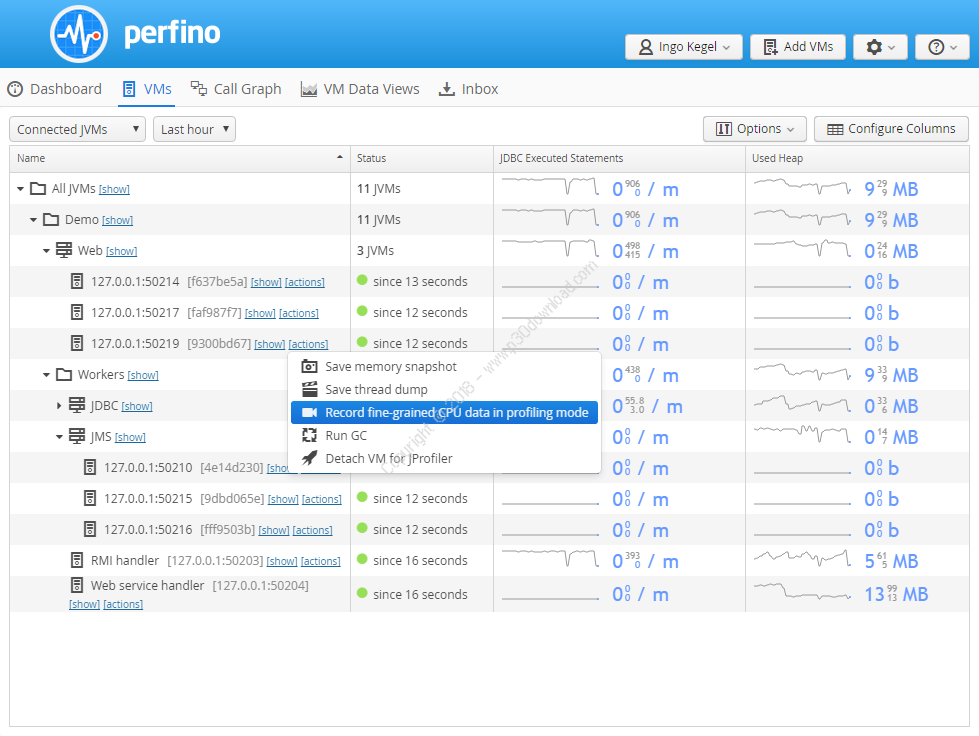
Cross-over to profiling
Defense in depth is a strategy that applies to many situations inlife. When your business is on the line, you sometimes need everytool there is and that is why perfino can bring in native JVMTIsampling and ultimately even prepare a VM for a JProfilerconnection. So that when you need the full capabilities of aprofiler, it’s at your fingertips.
Installer Size: 80 + 84 MB
Download Links > EJ Technologies Perfino v3.2 x86/x64 + Crack