


ScreenShots:
Software Description:
Tecplot, Inc. is a leading provider of data visualization andanalysis software. Located in Bellevue, Washington, Tecplotempowers engineers and scientists to discover, analyze, andunderstand information in complex data, and communicate resultswith professional images and animations. Our company culture iscasual, yet focused on providing high quality visualizationproducts that helps users to be more creative, efficient andproductive. With thirty years of experience, and thousands of usersworldwide, Tecplot, Inc. has become a trusted name in datavisualization.
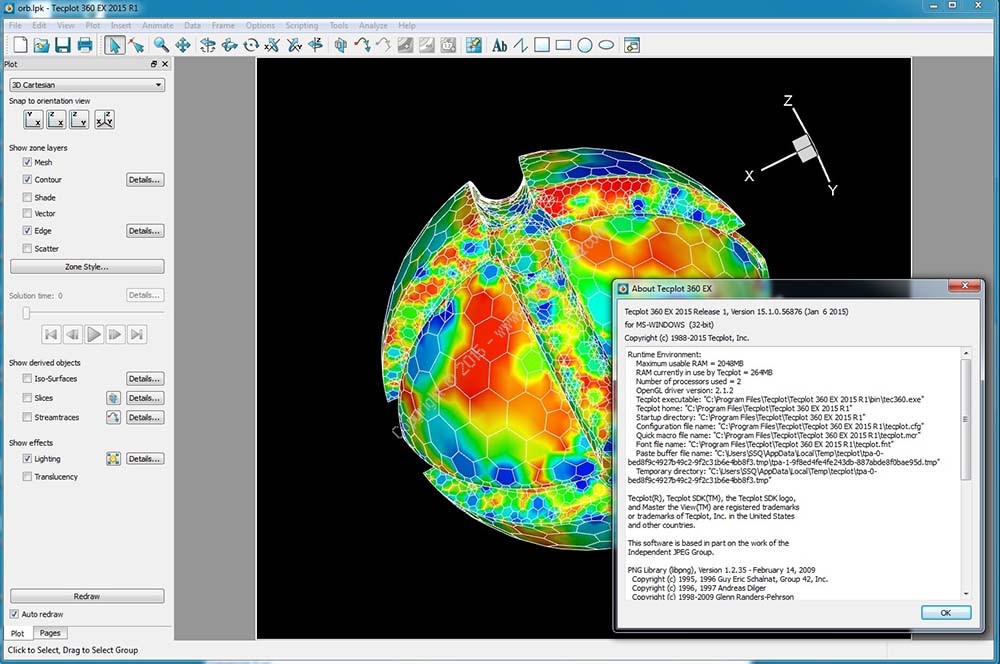
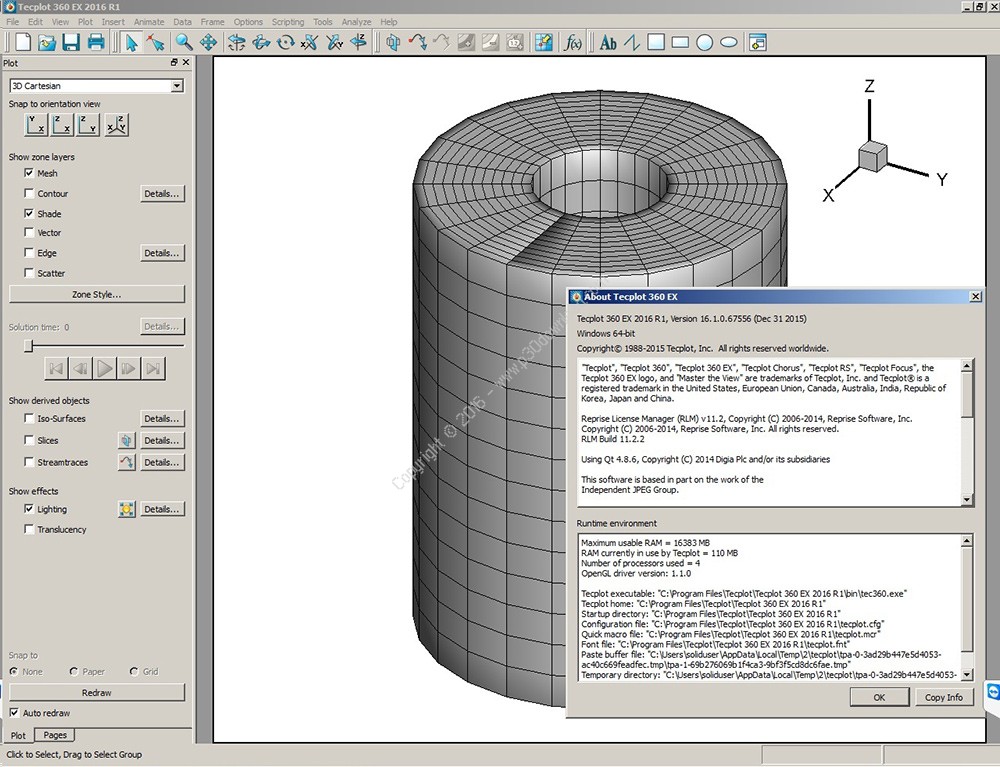
Tecplot 360
Tecplot 360 EX gets you answers faster. It helps you quickly plotand animate your data exactly the way you want. When you work withTecplot you gain a partner you can trust, offering the fastest andmost versatile desktop CFD visualization & analysis tool on themarket. You can quickly explore your data and present high-qualityimages and animations, exactly the way you want – and it’seasy.
With a 183 million cell CFD++ solution, Tecplot 360 EX with SZLtechnology is 23x faster and uses 93% less RAM than without SZLtechnology. Performance gains are even larger when compared toearlier versions of Tecplot 360. The data file using the SZL fileformat is also 70% smaller (11.3Gb down to 3.5Gb) than theequivalent PLT file due to lossless file compression.
Recent upgrades in Tecplot 360 EX help you work faster and moreeffectively. New interfaces for Mac and Linux are especiallyappreciated. The quick-macro panel, the macro debugger, right-clickcontext menus, simplified licensing, and the ability to createplots in multiple frames on multiple pages are by no means acomplete list.
Here are some key features of “Tecplot 360”:
Analyze Complex Results
– Load your data with support for 32 CFD, FEA, structural analysis,and industry-standard data formats.
– Unique multi-frame environment with multiple pages for reportingand comparing solutions.
– Understand XY, Polar, 2D and 3D plots using unique linkingcapabilities.
– Animate and step through transient solutions with videoplayer-style controls like forward, backward, loop, bounce, andthrottle control.
– Explore with interactive slicing, iso-surface, and streamtracetools.
– Automatically extract key flow features such as vortex cores,shock surfaces.
Explore Billion Cell Models
– Leverage multi-core desktop systems with multi-threadedcapability.
– Reduce load times of large computational results by up to 100times with Tecplot’s unique SZL technology.
– Lower memory requirements by more than 80% over earlierversions.
Verify Engineering Designs
– Assess your grid quality with 28 grid quality functions includingaspect ratios, Y+, skewness, orthogonality, and stretchfactors.
– Validate computational output with experimental data in by asingle plotting environment.
– Estimate the order of accuracy of your numerical solutions withRichardson extrapolation analysis.
– Interactively explore and sweep through flow field to check thatflow features align with the grid.
– Compare multiple models simultaneously, including Fluid-structureInteraction (FSI) visualization.
Communicate and Publish Reports
– Copy and paste images directly into Microsoft Officeapplications.
– Export professional, presentation-quality vector and rasterformats.
– Present multiple, time-linked views of your plots with Tecplot360’s unique multi-frame layout workspace.
– Optimize animations for PowerPoint and the Web.
– Create reports using unique multipage layouts.
Automate Routine Tasks
– Instantly apply a plot’s style attributes and layouts to adifferent set of data with layout and style files.
– Leverage over 180 macro functions to automate common analysis andplotting tasks.
– Create human readable text based macros by recording on screenactions.
Tecplot Features Over Time
Customers often ask which Tecplot 360 features were released ineach version of the product. We have compiled a list of thefeatures for each release from 2008 to the present.
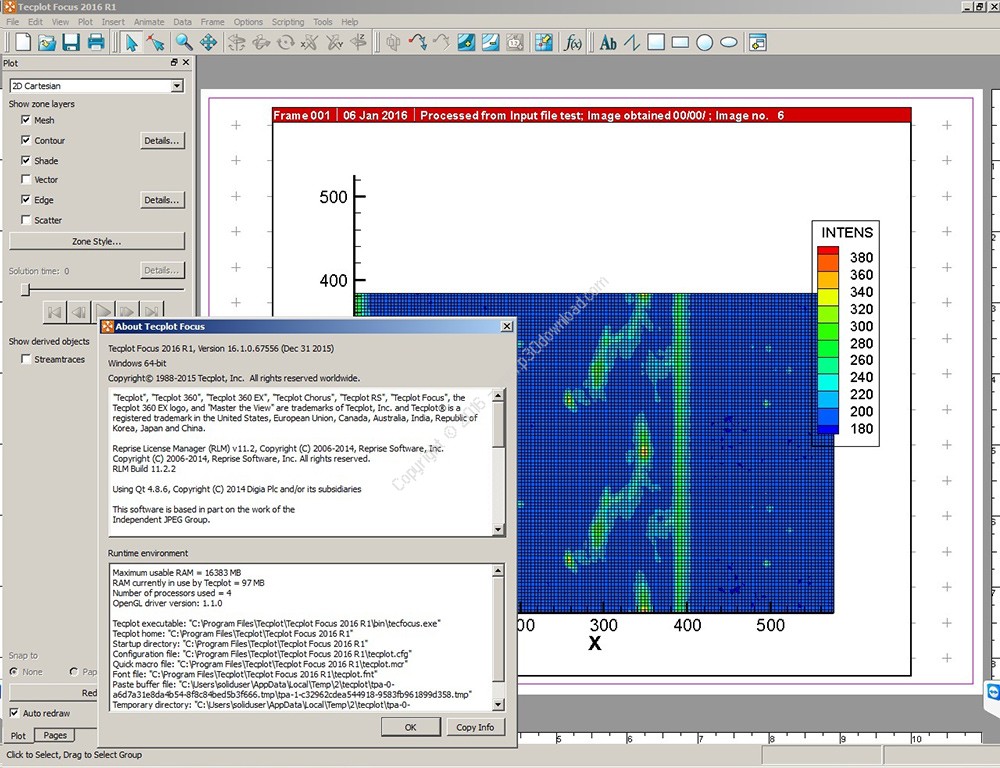
Tecplot Focus:
Tecplot Focus enables you to quickly plot your line and surfaceengineering and test data exactly the way you want. You can analyzeand explore complex data sets, arrange multiple XY, 2D and 3Dplots, and communicate your results to colleagues with high-qualityoutput.
Easily Understand Complex Engineering Systems
– Choose from an amazing array of XY, Polar, 2D and 3D plotting andanimation tools.
– Apply multiple constraints to define and create performanceenvelopes.
– Control over 2,500 attributes of your plot.
– View your work in up to 2048 drawing windows and from multipleperspectives (XY, 2D, and 3D) in a unique multi-frameworkspace.
– Assign arbitrary independent axes for specialty plots.
– Create complex performance plots.
– Plot irregularly spaced data.
– Probe values over time.
– Perform discrete Fourier transform (DFT).
Automate Plot Generation
– Instantly re-create an old plot, or apply the same styleattributes and layouts to a different set of data with layout andstyle files.
– Automate your work with a powerful scripting language.
– Create macros by recording or writing scripts.
– Use the Quick Macro Panel to access macros easily.
– Plot and print with batch processing.
– Extend Tecplot functionality with the Add-on Developer’s Kit.
Get Recognized
– Copy and paste images or animations directly into MicrosoftOffice applications.
– Export professional, presentation-quality images in vector andraster formats.
– Make optimized animations for PowerPoint and the Web.
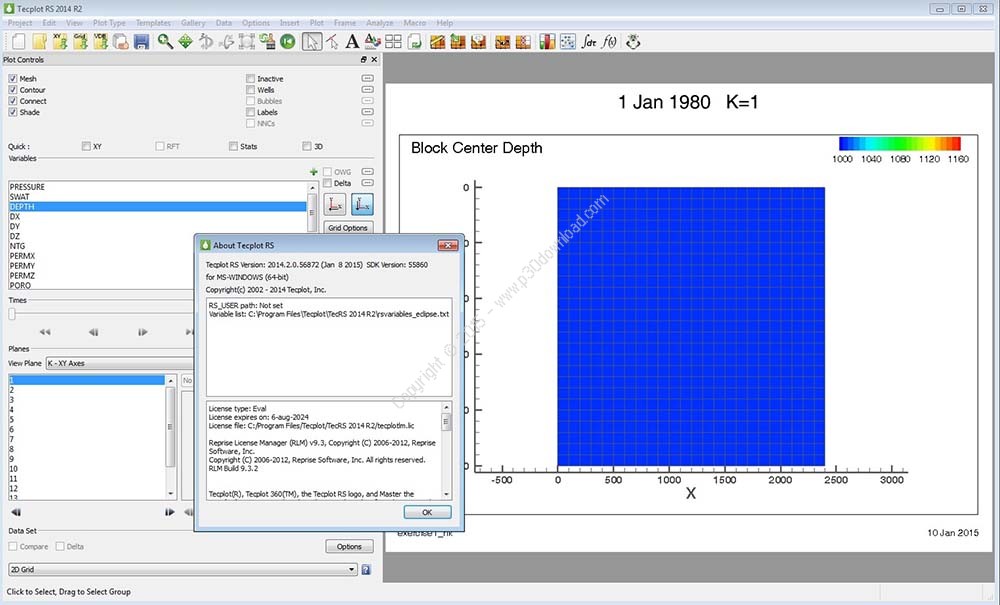
Tecplot RS:
Tecplot RS gives engineers the ability to manage and analyzesimulation data, uncover knowledge about reservoir model behavior,and gain confidence in making crucial decisions.
Here are some key Features of “TecplotRS”:
Integrated Work Environment
– Supports most major reservoir simulators.
– Compare data from multiple runs with historical well data whilesimultaneously viewing the well location in the context of the gridsolution.
– View bubble pie charts to analyze the relationship between wellproduction data and the movement of reservoir fluids.
Deep Reservoir Exploration
– Explore 3D solutions with arbitrary slices, blanking, andiso-surfaces.
– Interactively seed streamtraces in the reservoir flow.
– Examine multiple grid properties in one view.
– Display fault surfaces and explore adjacent grid properties.
– Calculate new grid and well variables using conditionalexpressions.
– Use delta bubbles to find regions with a poor history match.
Tecplot RS Streamlines
Understand your reservoir with Tecplot RS. Try it for free.
Tecplot RS differs from other visualization packages on the marketin several ways. Tecplot RS is easy to use, offers morecapabilities, and produces better-quality images, both on screenand hardcopy.
– James Gilman, Director of Engineering at iReservoir
Streamlined Reservoir Engineering Workflows
– Use the plot gallery to save specific XY, 2D, and 3D plotconfigurations and recall them
– at any point during the project.
– Record macros and templates to streamline repetitive tasks.
– Interactively define well groups and compare group results formultiple simulations.
– Modify properties for selected regions and output for subsequentruns.
Unique Analysis Tool
– Easily perform sums and averages of properties in regions andlayers.
– Create histograms and cross plots to gain statistical insightsfor your reservoir.
– Calculate periodic production rates from cumulativevariables.
– Integrate grid properties in subdivided regions andintervals.
– Quantify history match quality.
Responsive Tecplot Support
– Take advantage of new software releases twice per year.
– Get response from our technical support team in one day orless.
– Get help with installation, troubleshooting, and solutions forworkflow issues specific to your workplace.
Advisory Council
Made up of our largest customers, the Advisory Council members havea direct influence on the Tecplot RS feature design.
Quickly interrogate and compare multiple reservoir simulationruns
– Analyze solutions faster with the intuitive interface.
– Load data from multiple sources including most commercialsimulators.
– Compare multiple datasets in XY, 2D, and 3D views.
– View Grid solutions and production plots side-by-side.
– Output modified grid properties and use them with subsequentsimulation runs.
– Recall sets of views at any time from templates, macros, or theplot gallery.
– Arrange multiple plots on one page to quickly view data fornumerous wells, variables, and data sets.
Discover insights from your simulation results for a deeperunderstanding of the reservoir dynamics.
Histograms
– Create arbitrary slices to explore regions or follow welltrajectories of interest.
– Visually observe the time history of the reservoir gridproperties.
– Observe relationships between data with cross plots.
– Observe distribution of the data with histograms.
– Analyze data with one-click for integrations, KSUM, and KAVG.
– Evaluate user-specified “survey” wells.
– View bubble plots to understand relationship between productiondata and reservoir fluid movement.
Produce presentation quality output to effectively communicate yourresults and collaboratively make informed decisions
– Create high resolution images and movies.
– Output in formats such as avi, jpeg, tiff, flash, png, andpostscript.
– Copy and paste directly to PowerPoint, Word, etc.
– Create visually compelling graphics to enhance data viewing.
– Output in poster size formats.
– Control your output quality (anti-aliasing, aspect ratios,colors).
Installer Size: 290 + 102 MB
Download Links > Tecplot 360 EX + Chorus + Focus 2018 R1 v2018.1.1.87425 x64 + Crack