


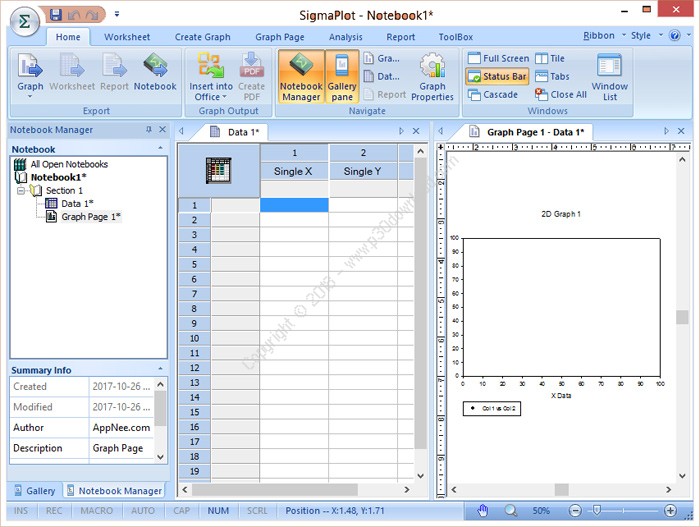

SigmaPlot software helps you quickly create exactgraphs
SigmaPlot graphing software from Systat Softwaretakes you beyond simple spreadsheets to help you show off your workclearly and precisely. With SigmaPlot, you can produce high-qualitygraphs without spending hours in front of a computer. SigmaPlotoffers seamless Microsoft Office integration, so you can easilyaccess data from Microsoft Excel spreadsheets and present yourresults in Microsoft PowerPoint® presentations.
Graphing software that makes data visualizationeasy
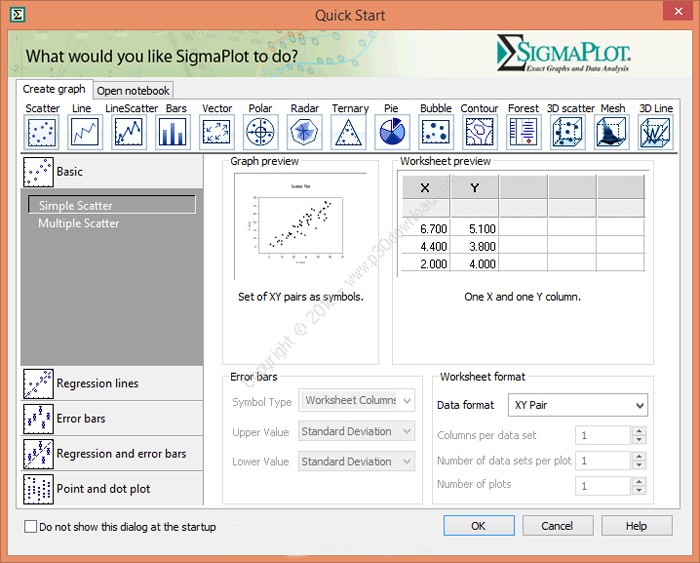
Graph creation starts with SigmaPlot’s award-winning interface.Take advantage of industry-standard menu design, menu toolbars,right mouse button support and graph preferences. Select the graphtype you want to create from the Graph Toolbar’s easy-to-readicons. The interactive Graph Wizard leads you through every step ofgraph creation. You get compelling, publication-quality charts andgraphs in no time. SigmaPlot offers more options for charting,modeling and graphing your technical data than any other graphicssoftware package.
Compare and contrast trends in your data by creating multiple axesper graph, multiple graphs per page and multiple pages perworksheet. Accurately arrange multiple graphs on a page usingbuilt-in templates or your own page layouts with SigmaPlot’sWYSIWYG page layout and zoom features.
More than 100 2-D and 3-D technical graphtypes
From simple 2-D scatter plots to compelling contour plots,SigmaPlot gives you the exact technical graph type you need foryour demanding research. And, to help you see interactions in your3-D data, SigmaPlot powerfully renders multiple intersecting 3-Dmeshes with hidden line removal. With so many different chart andgraph types to choose from, you can always find the best visualrepresentation of your data.
Customize every detail of your charts andgraphs
SigmaPlot offers the flexibility to customize every detail of yourgraph. You can add axis breaks, standard or asymmetric error barsand symbols; change colors, fonts, line thickness and more.Double-click on any graph element to launch the Graph Propertiesdialog box. Modify your graph, chart or diagram further by pastingan equation, symbol, map, picture, illustration or other image intoyour presentation.
Quickly Plot your Data from Existing Graph Templates in theGraph Style Gallery
Save all of the attributes of your favorite graph style in the newGraph Style Gallery. Add greater speed and efficiency to youranalysis by quickly recalling an existing graph type you need andapplying its style to your current dataset.
– Quickly save any graph with all graph properties as a style andadd a bitmap image to the gallery
– No need to be an expert, create customized graphs in no time withthe Graph Gallery
– Choose an image from the Graph Style Gallery to quickly plot yourdata using an existing graph template
– Save time by using a predetermined style to create a graph of thedata
– Avoid re-creating complex graphs
Publish your charts and graphs anywhere
Create stunning slides, display your graphs in reports or furthercustomize your graphs in drawing packages. Save graphs forpublication in a technical journal, article or paper withSigmaPlot’s wide range of graphic export options. Presenting andpublishing your results has never been easier – or looked thisgood. Create customized reports with SigmaPlot’s Report Editor orembed your graphs in any OLE container – word processors, MicrosoftPowerPoint or graphics program. Just double click your graph toedit directly inside your document. Quickly send yourhigh-resolution graphs online to share with others.
Share high-quality graphs and data on the Web
Export your graphs as high-resolution, dynamic Web pages – notsimple GIF or JPEG files. Viewers can explore data used to creategraphs and zoom, pan or print images at full resolution directlyfrom a Web Browser. Automatically generate active Web objects fromyour graphs or embed the objects within other Web pages.
– Share the data behind your graphs with colleagues andstudents
– Enable colleagues to print your full report from your intranet orWeb site directly from their browsers – without compromising thequality of the graphs
– Create an optional password while exporting your graph to limitdata access to authorized users
– Produce Web documents without knowing HTML, or embed SigmaPlotWeb object graphs in existing HTML files to create interactiveelectronic reports
Graphing software that also delivers the data analysistools you need to draw solid conclusions
Data Analysis Doesn’t Get Any Easier
SigmaPlot provides all the fundamental tools you need to analyzeyour data from basic statistics to advanced mathematicalcalculations. Click a toolbar button to instantly generate summarystatistics including 95% and 99% confidence intervals. Run t-tests,linear and non-linear regressions with ease. You can fit a curve orplot a function and get a report of the results in seconds. Usebuilt-in transforms to massage your data and create a unique chart,diagram or figure. With SigmaPlot – it’s all so simple!
Use SigmaPlot within Microsoft Excel
Access SigmaPlot right from your active Microsoft Excel worksheet.Tedious cut-and-paste data preparation steps are eliminated whenyou launch SigmaPlot’s Graph Wizard right from the Excel toolbar.Use Excel in-cell formulas, pivot tables, macros and date or timeformats without worry. Keep your data and graphs in one convenientfile. [top]
Use the Regression Wizard to fit data easily andaccurately
Fitting your data is easy with the SigmaPlot Regression Wizard. TheRegression Wizard automatically determines your initial parameters,writes a statistical report, saves your equation to your SigmaPlotNotebook, and adds your results to existing graphs or creates a newone! The Regression Wizard accurately fits nearly any equation -piecewise continuous, multifunctional, weighted, Boolean functionsand more – up to 10 variables and 25 parameters. You can even addyour own powerful curve fits to the Regression Wizard.
Plot ANY mathematical function
Plotting user-defined and parameterized equations is only amouseclick away with the Function Plotter. Just type the functionor select one from the built-in library and specify the parametersand the range. It’s that simple! Create your own built-in functionsand save them for future use. Plot functions on new or existinggraphs or plot multiple functions simultaneously using differentparameter values. Save plotted X and Y results to theworksheet.
Maximize your Productivity with SigmaPlot’sAutomation
Automate Complex Repetitive Tasks
Create macros in no time with SigmaPlot’s easy-to-use macrolanguage. Not a programmer? No problem. With SigmaPlot, you canrecord macros by point-and-click with the macro recorder. Usemacros to acquire your data, execute powerful analytical methods,and create industry-specific or field-specific graphs. Use built-inmacros as provided or use these macros as a base to quickly createyour own macros.
Share the power of SigmaPlot with less-experienced users by usingmacros to tailor the SigmaPlot interface for your particularapplication. Create custom dialog boxes, menu choices and forms tohelp guide novice users through a session.
Tap into SigmaPlot’s powerful capabilities from withinother applications
Call on SigmaPlot’s functionality from external sources that haveVisual Basic embedded including Microsoft Word and Microsoft Excelor custom software applications. Analyze and graph your data usingSigmaPlot within those applications. For example, you can run aVisual Basic script in Microsoft Word or Excel that calls onSigmaPlot to generate and embed your graph in the document.SigmaPlot’s OLE2 automation provides unlimited flexibility.
File Size: 153 MB
Download Links : Systat SigmaPlot v13.0 + Crack